About this project
This project explores water use in the Dutch economy using official
statistics. The Python script loads raw CSV data, cleans and
aggregates it with Pandas and NumPy, and generates visual summaries
with Matplotlib and Seaborn. The plots below are saved by
main.py into the plots/ folder and embedded
here.
Run the analysis yourself (local only)
These stats and forecasts are generated by a local Python script. To reproduce or update them:
- Download main.py to the same folder as this page.
- Install Python 3 (with “Add to PATH”), then run:
python -m pip install pandas numpy matplotlib seaborn requests - In the folder containing
main.pyand your CSV, run:python main.py - Enter how many years ahead to forecast when prompted.
- Refresh this page; it will read the new
plots/*.pngandplots/forecast_total_economy.csv.
Note: GitHub Pages cannot execute Python. You must run main.py locally to regenerate data/plots.
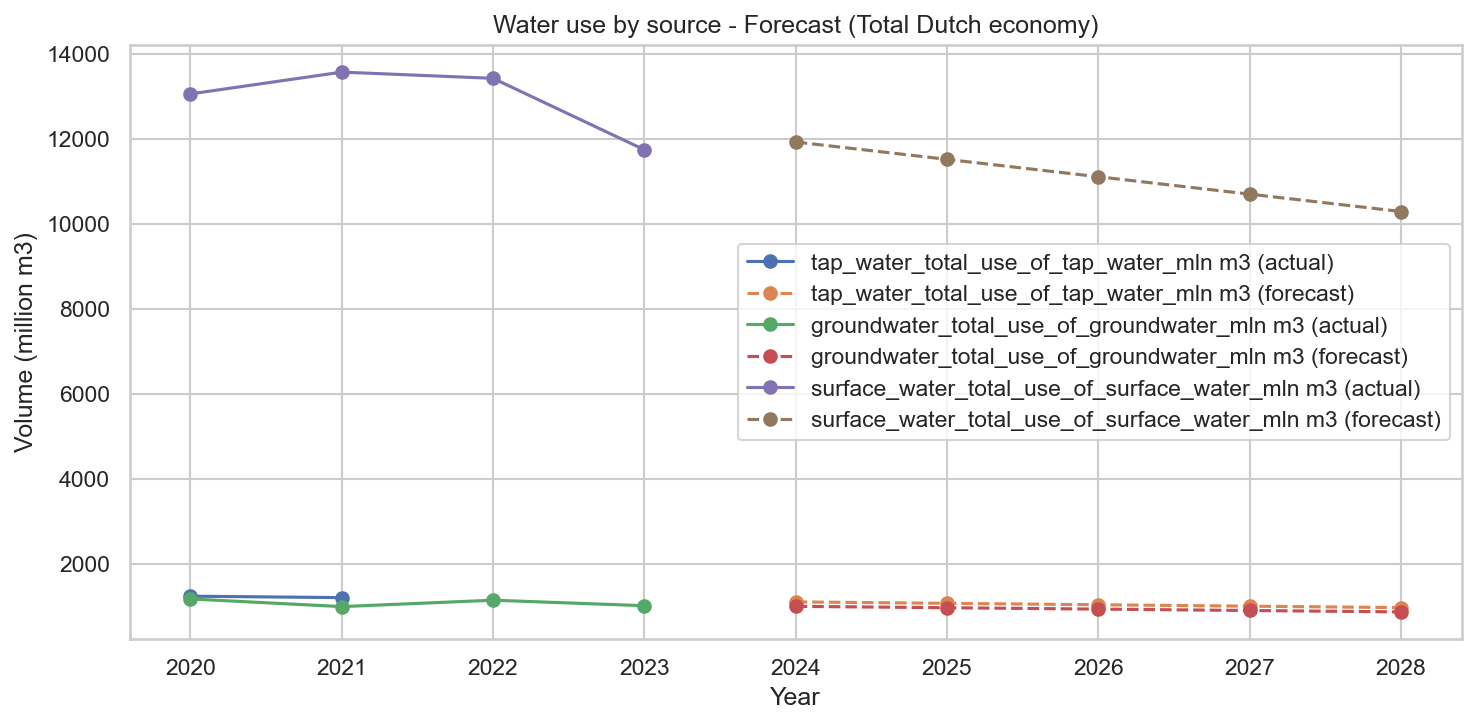
Forecast: water use by source (Total Dutch economy)
A simple linear-trend model trained on historical totals projects tap, groundwater, and surface water use for future years.
Run main.py and enter how many years ahead to forecast; the plot below updates and is saved in plots/.
Download script: main.py (run locally to regenerate forecasts)
Interactive forecast explorer
Explore the forecasted water use by source (tap, groundwater, surface) for the total Dutch economy.
This widget reads plots/forecast_total_economy.csv produced by main.py.
Adjust filters to change the view; if the data is missing, rerun the script locally and push the updated CSV/plots to GitHub Pages.
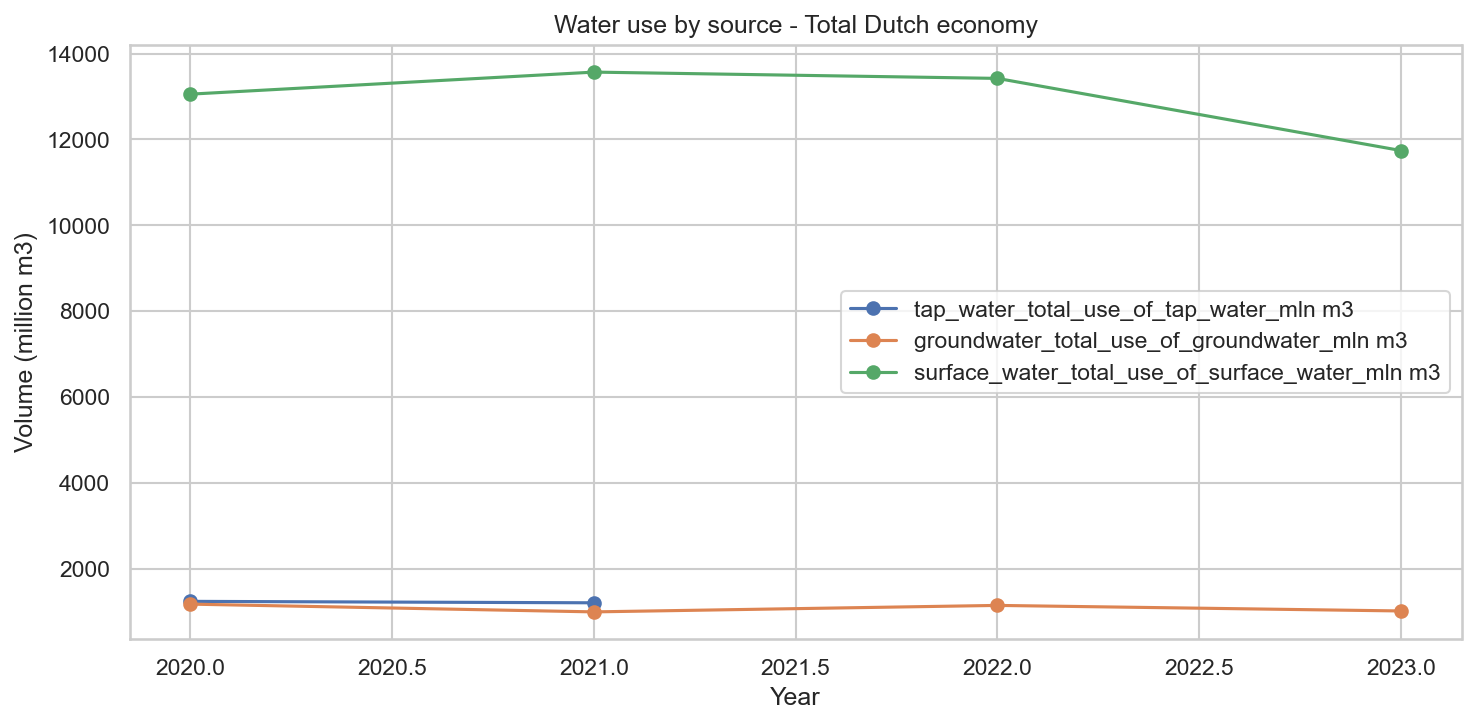
Water use by source (Total Dutch economy)
Evolution of tap water, groundwater, and surface water use (million m3) for the total Dutch economy over time.
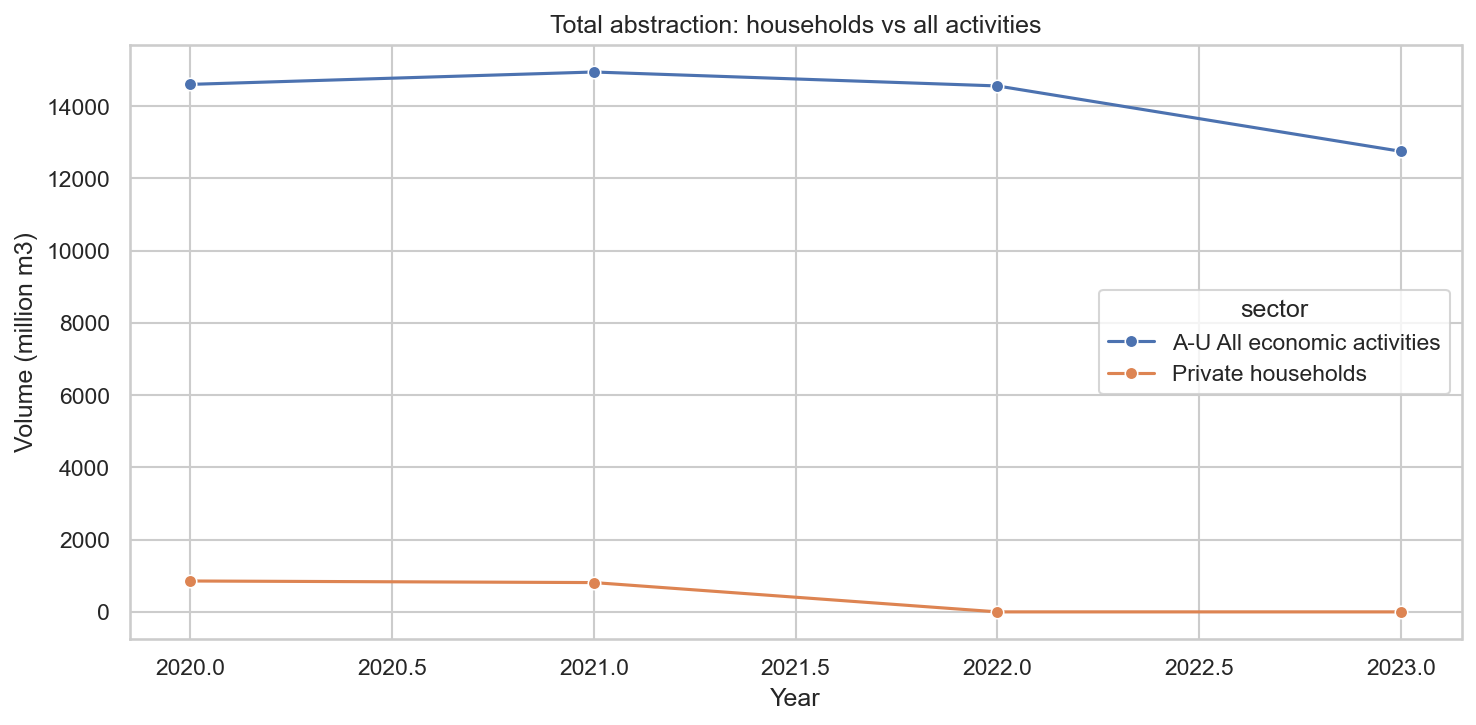
Households vs all economic activities
Comparison of total water abstraction for private households versus all economic activities (A–U) in the Netherlands.
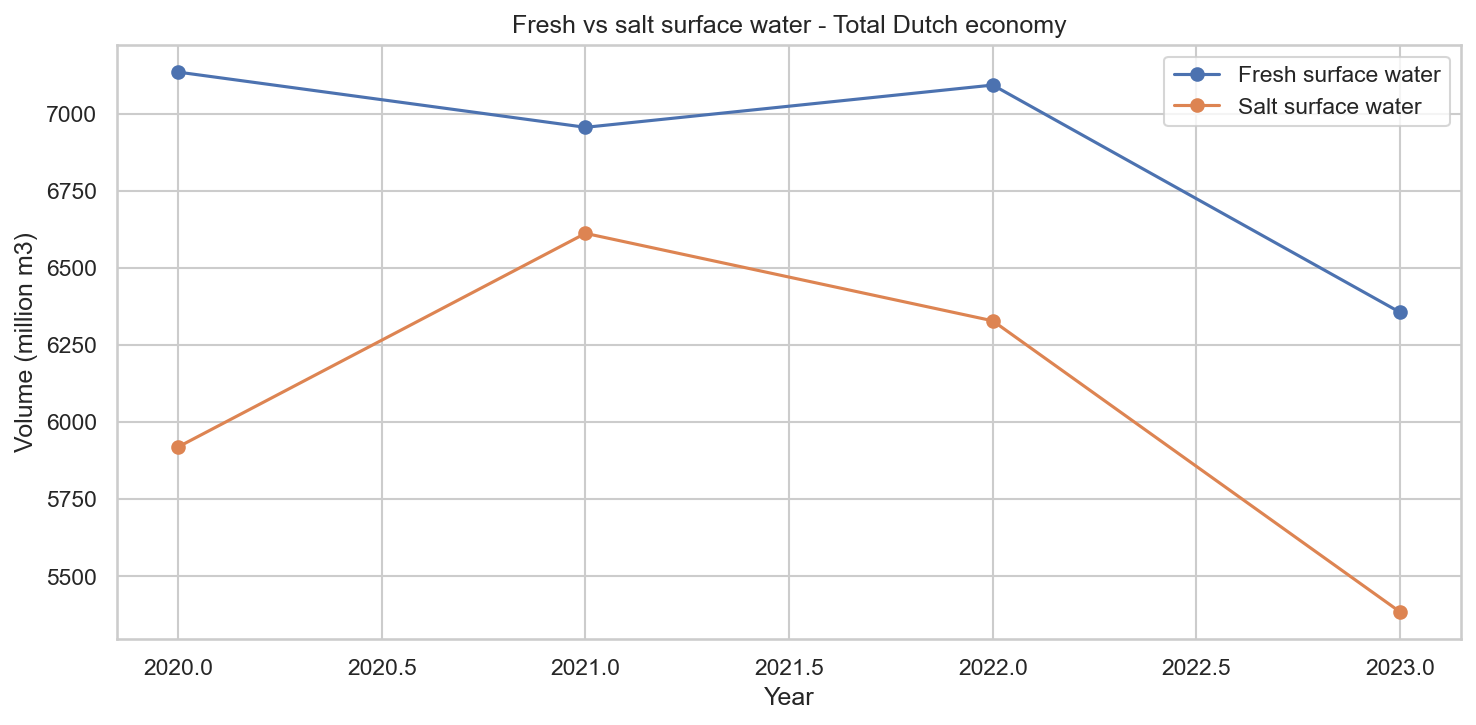
Fresh vs salt surface water
Use of fresh and salt surface water by the total Dutch economy, highlighting the relative importance of each source.